
I've been using Honey Money, a clear-cut budgeting software built around manually entering transactions, to track my spending since 2017. Given the past year (2020) has been quite a change from the year prior, I thought it would be interesting to pull down that data and see what a difference quarantine has had on my spending habits. I wouldn't say there are a ton of surprises and I'm quite limited by my weak handle of spreadsheet software, but it did reaffirm a few things. In 2020 I spent less on travel, lunch, and in total while spending more on groceries.
Disclaimers: this isn't a particularly scientific result. There are a couple confounding factors. My wife's purchases are not reflected here even if I may have benefited from them. She is the only person in the household with DoorDash. When boba shops, for instance, stopped accepting orders in person, I stopped being the one to pay them and Yvonne would place the order online. Additionally, I'm quite bad at tracking my cash. While I get reminder emails from my credit card company for each purchase, I don't get the same notification from my wallet. I also don't calculate the amount I spend on laundry at my apartment which is ~$3 a load in quarters (my god is it hard to find quarters). I'd estimate I spent $70 in 2019 and $50 in 2020. Don't judge me. No one but my wife has to smell my clothes these days.
2019 was a pretty wild year for me. In March I was laid off (and given a loving severance + GDC tickets-- I love you guys) and started working elsewhere a month and some change later. The huge spike of expenses in May and July were when my then fiancee and I were reserving flights and an airbnb for our honeymoon in Saigon. The notable spike of income in September comes from wedding gifts. While 2019 was rather extraordinary, the expenditures were about on par with previous years. Each year we'd likely take one major international trip and a few short regional ones. In total, I saved 39% of my income this year.
The year after has an obvious (at least to 2021 me) shift in spending. The income bump in February is my tax return while the bumps in April and December are from government covid relief checks. The few major expenditures were for a short (and failed) homefinding trip and a month-long visit to Ohio. The flights were incredibly cheap and surprisingly I didn't get sick. I saved 60% of my income in 2020.
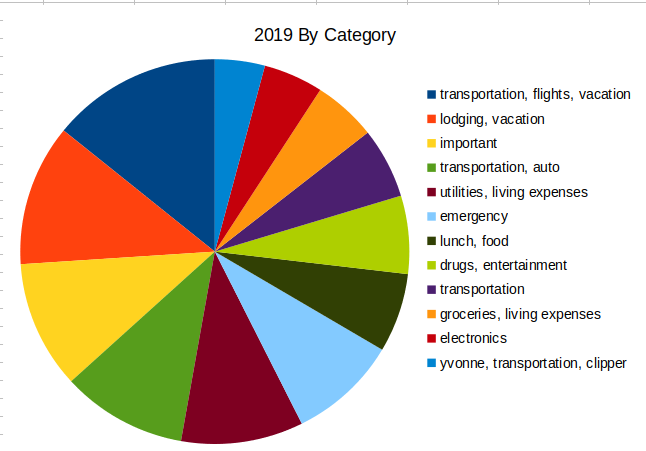
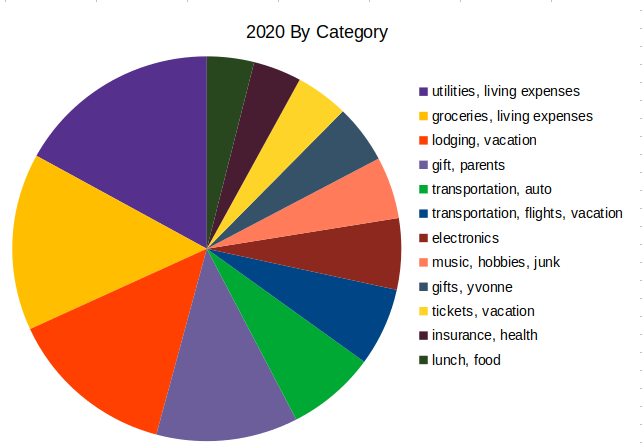
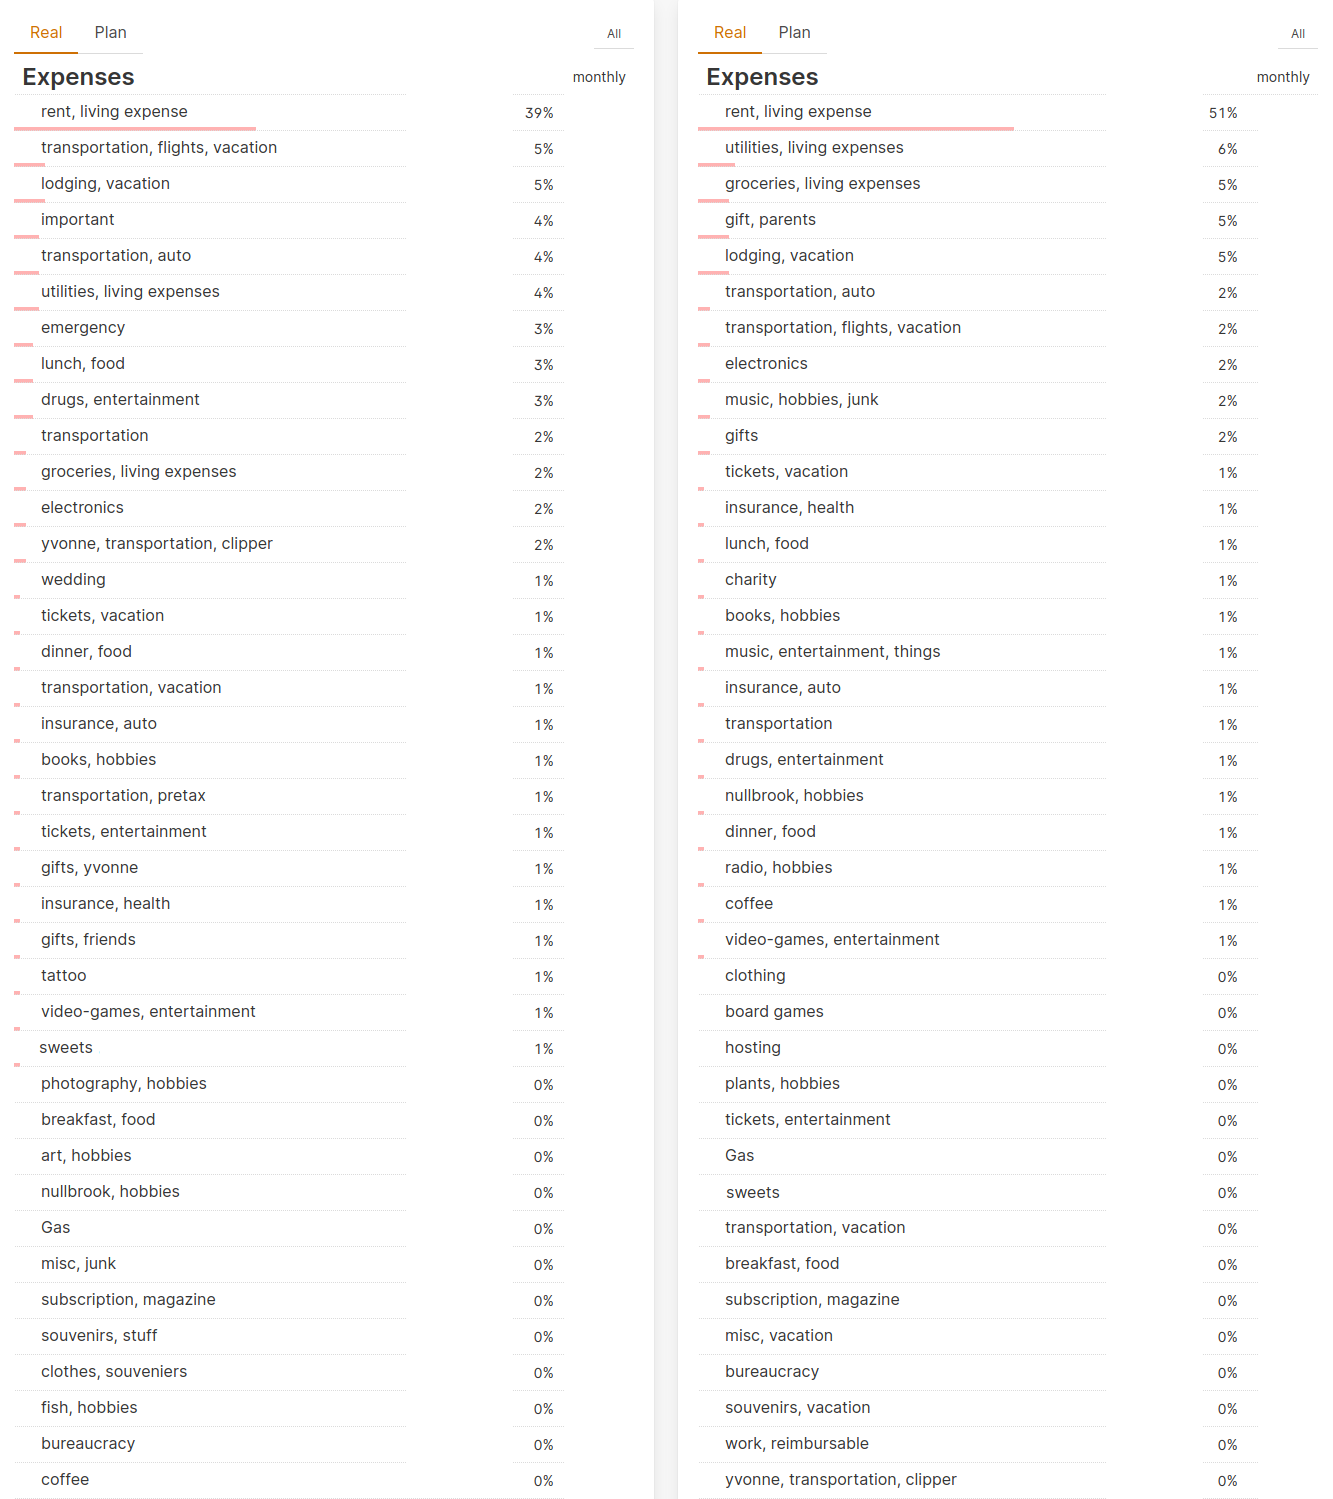
This is excluding rent since that takes up half the pie chart and is constant between both years. Also sorry this isn't color-blind friendly. LibreOffice Calc is pretty limited.
My biggest expense in both years by an order of magnitude is rent. I live in the Bay Area (for now) so it's to be expected that I'm shovelling a nice chunk of my income into the abyss. That means that most of the expenses shown in these charts would be expected to fluctuate based on lifestyle patterns. That being said, the utilities, living expenses category could be expected to remain roughly the same between years. However, increased time at home in 2020 increased that expense by 15%. To be fair, for the month we were on our honeymoon, our power bill was $5.
To speak to some of the categories of expenses here, the important label applied to wedding preparations and drugs, entertainment includes all forms of alcohol as well as cigarettes. The 70% drop-off of alcohol purchases can be attributed to shift from $10 bar beers to 50 cent grocery store beers. There's also the fact I remembered to write down the ~$500 of alcohol we spent in Vietnam. It was worth it to try actual absinthe. The most notable shifts in expenditures are in food and transportation. After the work-from-home order in February, I stopped having the convenience of $10-15 food, lunch shops within reach. I know several of those shops are closed for good. It's possible I'll be using the home meal prep skills I learned in quarantine to provide my own lunches in the future. The disappearance of the transportation and transportation, yvonne, clipper expense is the result of our BART commutes turning into memories. I do miss public transit, but I miss foreign public transit more.
In addition to doubling my budget allocation on groceries in 2020 (97%), I also spent twice as much on physical music (mail ordering is expensive). Yet I'm left with the deep regret that I sold my nice Roland synthesizer keyboard months before covid began. I've been dawdling on a CDJ and 8-tracker for over a year now. Even with these changes and sizable increases in my monthly Digital Ocean and Patreon spend, I saved nearly 3x my rent spend. In retrospect, I'm seeing I should be giving back more to those community institutions I used to enjoy. Here's to hoping the contributions can tide them over until we're allowed to return to the outside.
Finally, a thoroughly expected outcome: I used cash in fewer transactions in 2020. Between the inability to visit stores in person and the fact that most stores that were open tended to frown upon paper money, I only used cash 27 times (6%). Nearly all of these transactions were before April. In 2019 I had 109 (15%) cash transactions recorded. This is a trend that the powers that be have been trying to enforce for years in the name of analytics and fraud prevention. Doesn't prevent corruption, does it? Shitlords. Anyway, I'd love to use cash more, but it doesn't email me when it leaves my wallet. Sometimes the power convenience is just too great. I just hope that the pandemic hasn't been the end of actually owning money.
To continue philosophizing a bit, I started tracking my finances to understand how I spend what I've earned. The main take away has been that I'm incredibly lucky to retain my job through the pandemic and stay in good health. If anything, it's well past time I share this fortune with others. Looking back in several years, post-Bay Area, I imagine a substantially altered distribution.